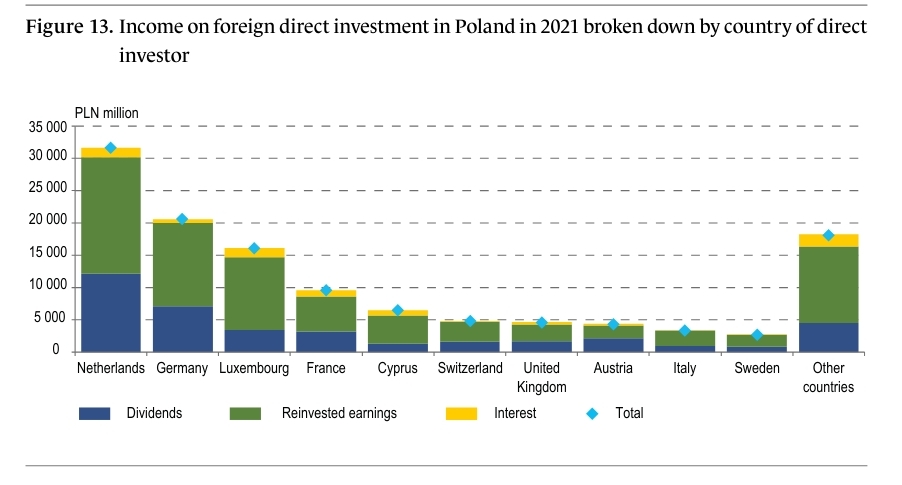
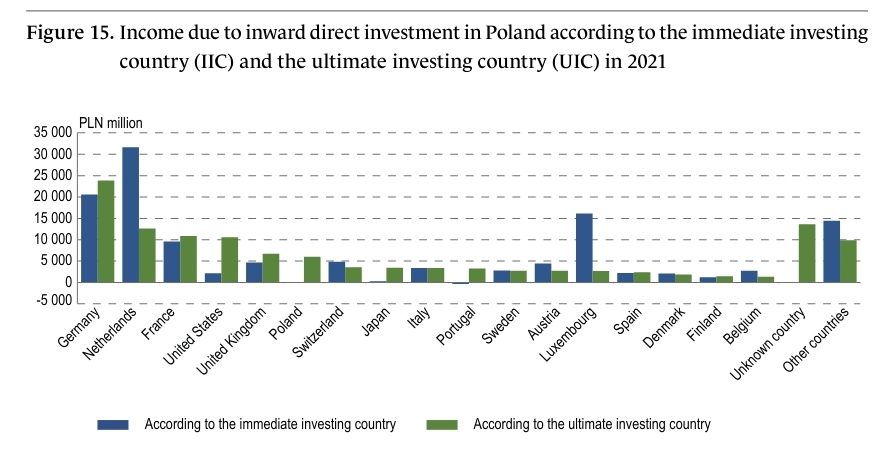
This graph is not related at all, it’s from 2021 and it’s global investments, look at the y axis. Poland would barely be shown there as pixel. And in the other graphs in your link you can see that US investments in Poland were less than Belgian or Swiss or Swedish, and even by the ultimate flow of capital still half of German ones and less than Netherlands.
This graph is not related at all, it’s from 2021 and it’s global investments, look at the y axis. Poland would barely be shown there as pixel.
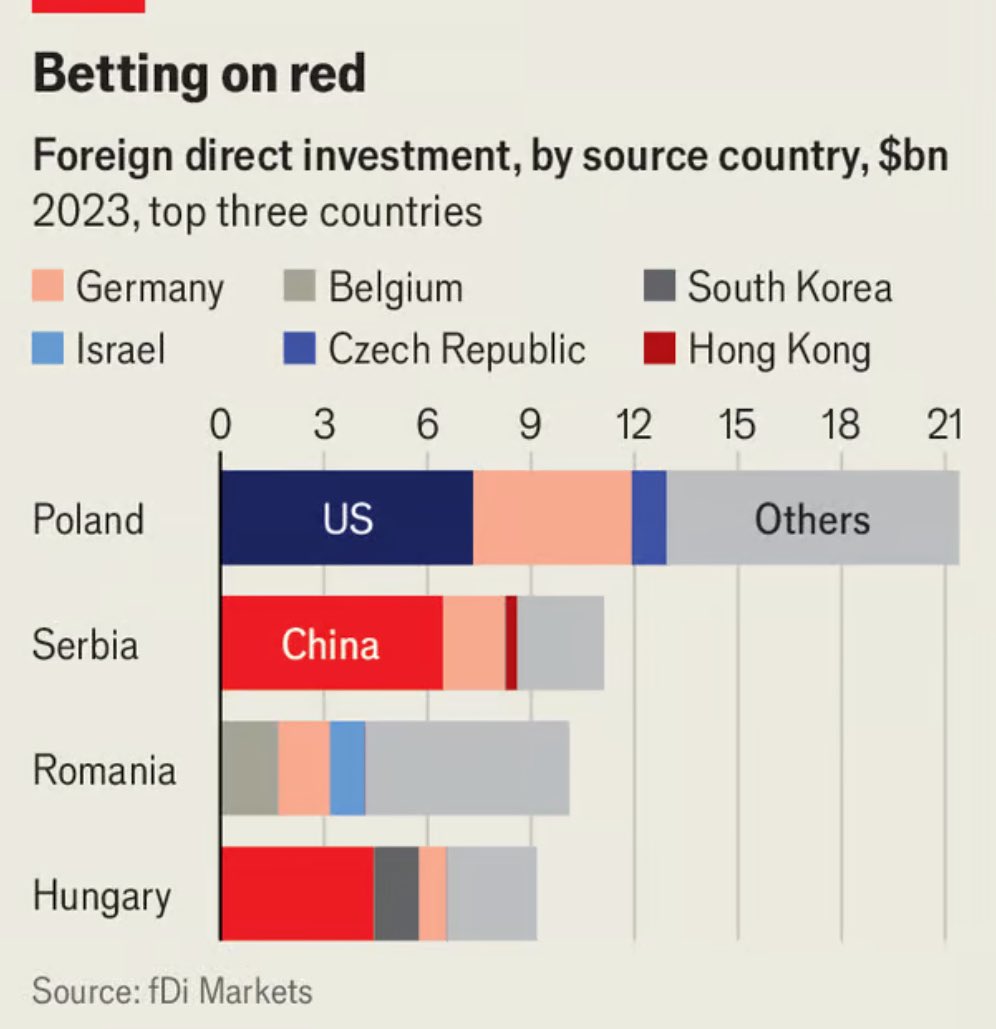
And in the other graphs in your link you can see that US investments in Poland were less than Belgian or Swiss or Swedish
Yep, you’re right about the y-axis, i’ve read that too quickly.
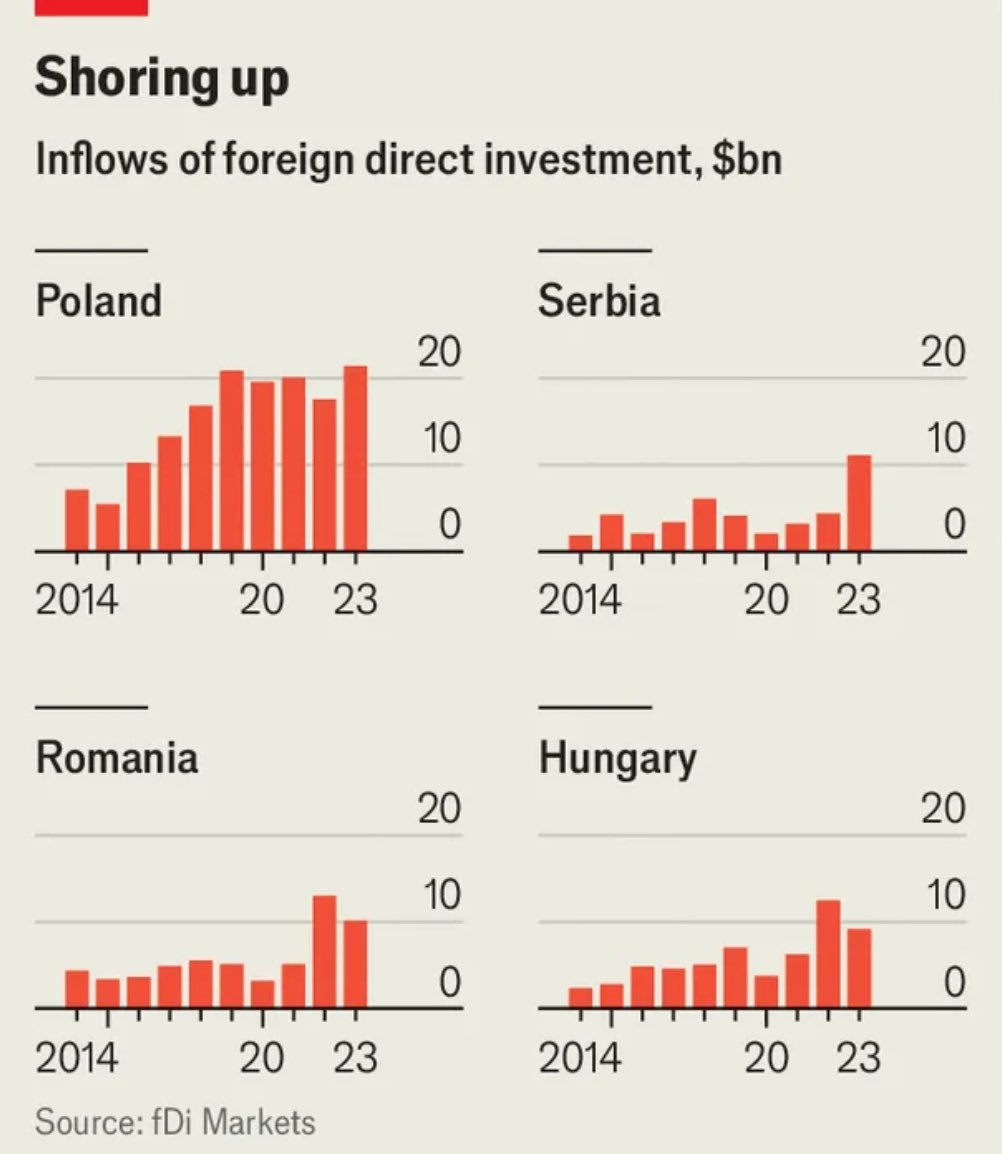
And the other graphs in the pdf seem indeed to confirm that 2023 was an exception :
I should probably research it a bit more to have a more precise point of view.

I.d.k., but even if it was scrapped it’s probably counted in.
I’ve found this graph here :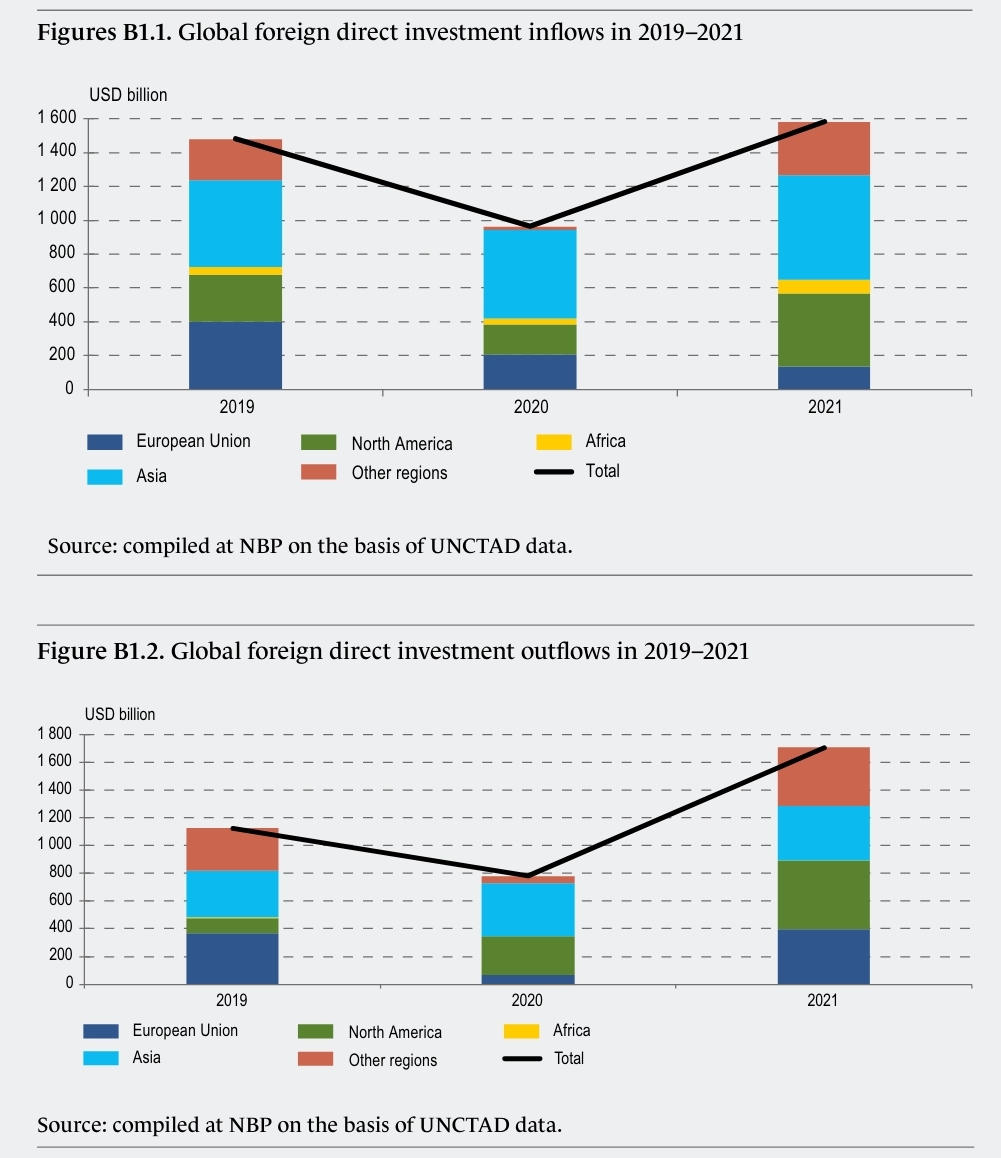
This table here may be a good enough answer ?
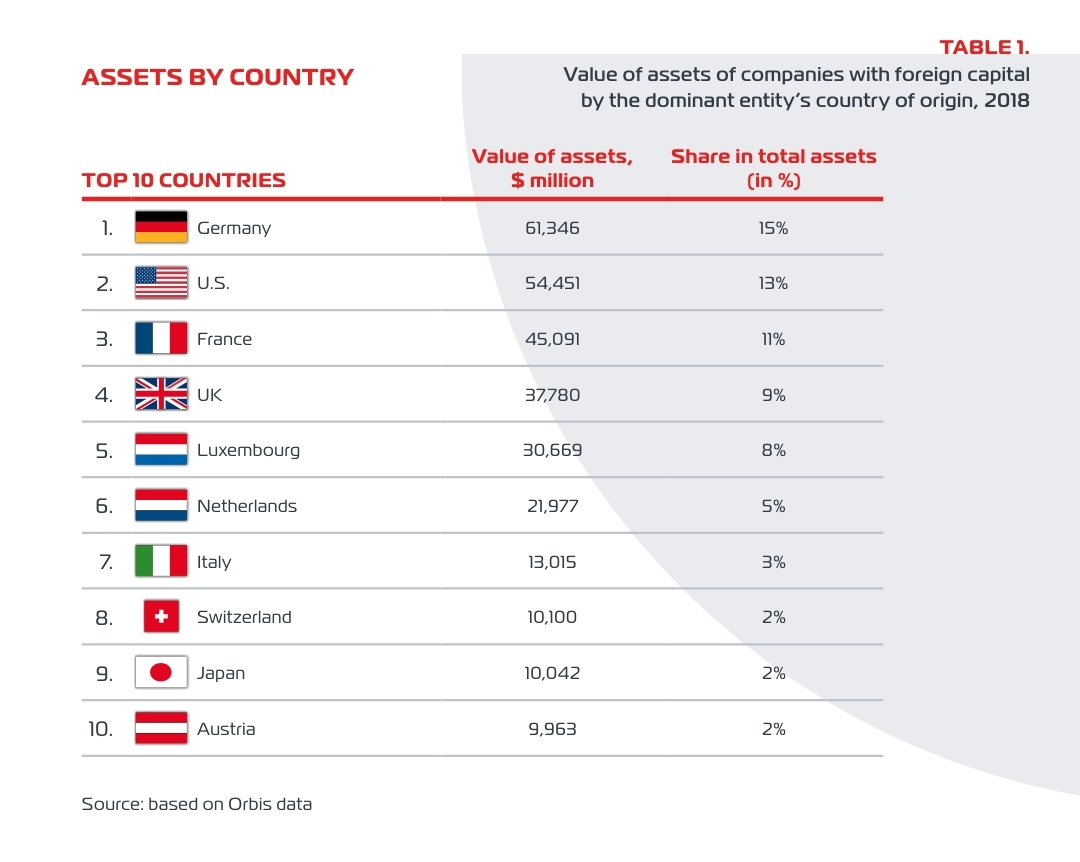
This graph is not related at all, it’s from 2021 and it’s global investments, look at the y axis. Poland would barely be shown there as pixel. And in the other graphs in your link you can see that US investments in Poland were less than Belgian or Swiss or Swedish, and even by the ultimate flow of capital still half of German ones and less than Netherlands.
Yep, you’re right about the y-axis, i’ve read that too quickly.
And the other graphs in the pdf seem indeed to confirm that 2023 was an exception :
I should probably research it a bit more to have a more precise point of view.
I wonder if this really were all military expenses.